Are you measuring the right data to grow your business? With 2.6 billion online shoppers worldwide, digital success hinges on tracking the correct indicators. Yet, only 23% of professionals focus on meaningful KPIs, leaving 77% overwhelmed by irrelevant numbers.
E-commerce now drives 33% of global sales, making precise measurement non-negotiable. Vanity metrics like social media likes rarely translate to revenue. Instead, focus on strategic indicators such as customer lifetime value (CLV) and acquisition costs (CAC).
Harvard Business School’s Sunil Gupta emphasizes identifying funnel bottlenecks. The right analytics reveal where prospects drop off and where investments pay off. Tools like Planful streamline this process, turning raw data into actionable insights.
Key Takeaways
- Most teams track the wrong KPIs, missing growth opportunities
- Global e-commerce growth demands accurate performance tracking
- Strategic metrics like CLV outperform vanity indicators
- Funnel analysis exposes critical conversion barriers
- Specialized software simplifies data-driven decision-making
Introduction to Marketing Metrics
What separates thriving campaigns from stagnant ones? The answer lies in strategic measurement. Modern teams use marketing metrics as compasses, tracking progress across plans and adjusting tactics in real time. With 21% of organizations now reviewing data quarterly, agility is no longer optional.
Every customer journey follows three stages: awareness, consideration, and decision. A SaaS company might measure demo requests (consideration), while an e-commerce brand tracks cart abandonment rates (decision). These metrics expose bottlenecks—like a leaky funnel—where prospects drop off.
Tools like Google Analytics offer broad traffic insights, while HubSpot drills into lead behavior. The choice depends on whether you need macro trends or micro-conversions. For example, A/B testing landing pages with different CTAs falls under experiment-driven optimization, a tactic 43% of high-growth firms use monthly.
Ultimately, the right data transforms guesses into growth. Teams that align KPIs with funnel stages see 28% faster pipeline progression, proving that precision beats volume every time.
Why Tracking the Right Marketing Metrics Matters
What’s the cost of tracking the wrong indicators? For every dollar spent, misaligned KPIs drain resources. Research shows companies grow 2.8x faster when metrics match strategic goals.
Focusing on MQLs (Marketing Qualified Leads) over SQLs (Sales Qualified Leads) skews ROI. A $500 cost-per-lead crushes profitability if customer lifetime value sits at $1,000. Prioritize quality, not just quantity.
Starbucks nails this balance. By tracking Net Promoter Score (NPS), they refine loyalty programs. Happy customers spend 3x more—proof that the right data drives success.
Harvard Business Review found teams with aligned marketing efforts outperform peers by 37%. Vanity metrics like email open rates mislead. One brand lost $200K chasing opens instead of conversions.
For business growth, measure what moves the needle. CAC doubles when teams fixate on irrelevant data. Smart tracking turns guesses into gains.
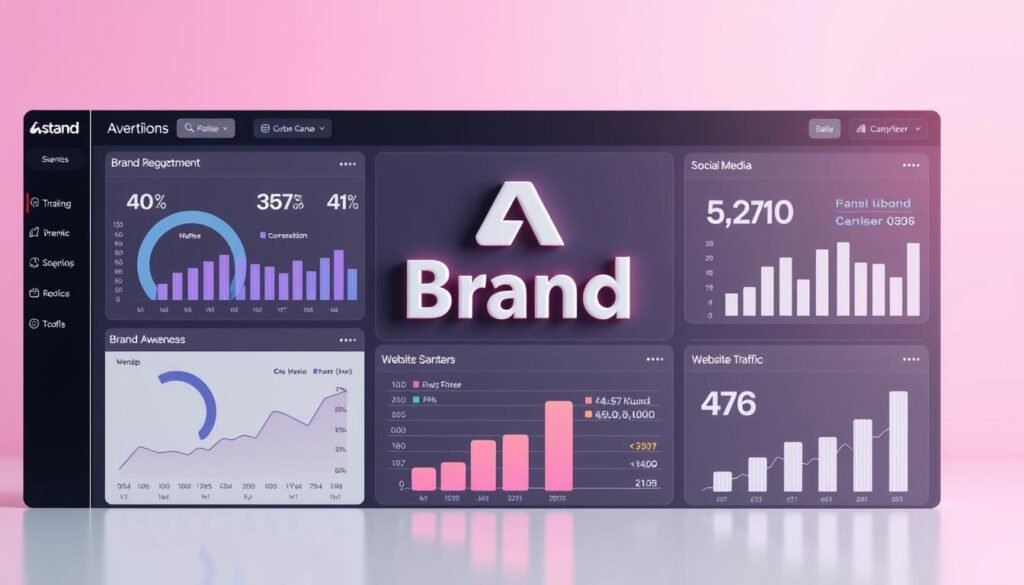
Brand Awareness Metrics
How do you measure if your brand truly stands out? Awareness metrics reveal how often your audience sees and remembers you. With 90% of clicks happening on the first search page, visibility is everything.
Impressions
Impressions track how often your ads or content appears. Google Ads averages $0.50 CPM, while LinkedIn hits $2.50. Budgets stretch further with precise targeting.
First-Page Keyword Rankings
Ranking on page one drives 6.6% CTR versus 0.6% for display ads. Tools like Moz and SEMrush track positions. Ahrefs offers deeper backlink insights.
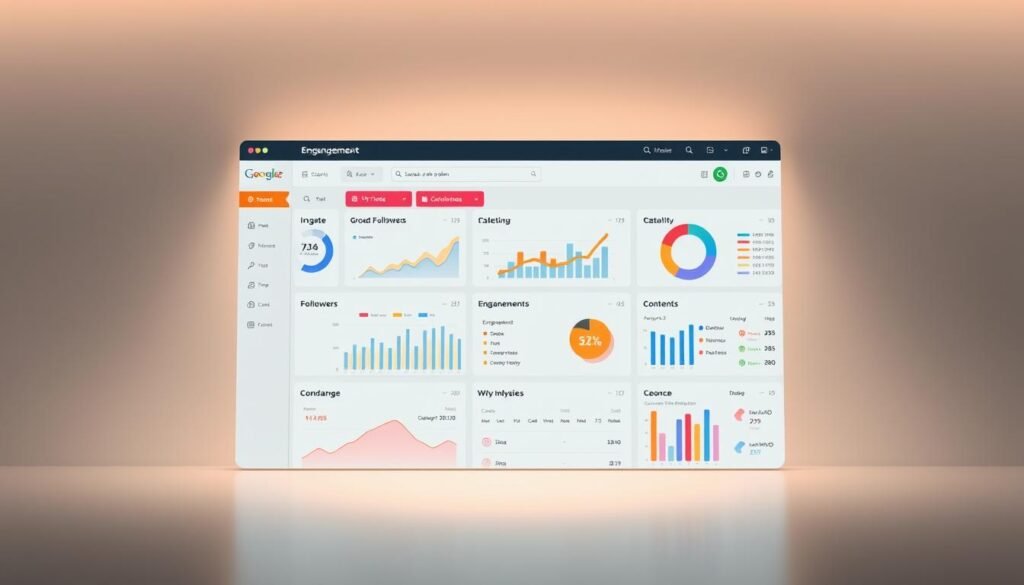
Social Media Engagement Metrics
TikTok’s 8% engagement rate dwarfs Instagram’s 1%. Compare platforms to prioritize high-impact channels. Quality content fuels shares and comments.
Analyze these metrics weekly. Adjust strategies to dominate search and social media. Awareness fuels growth.
Pipeline Metrics
Pipeline health determines whether deals close or stall. Focus on stages that directly impact revenue, like SQLs and second meetings. Companies with optimized pipelines see 22% faster velocity, per HubSpot.
Second-Stage Meetings
After initial contact, demos seal the deal. Salesforce reports a 68% close rate post-demo. Prioritize meetings with high-intent leads.
Sales Qualified Leads (SQLs)
SQLs convert 3x better than MQLs. Use lead scoring to identify hot prospects. Attributes like budget and timeline separate SQLs from tire-kickers.
Deals Closed from Marketing
Attribution models clarify impact. First-click credits awareness efforts. Last-click highlights final touches. Blend both for a full picture.
Pipeline Progression (Close Rate)
Monday.com cut cycles by 14 days via automation. Track progression weekly to spot delays. Faster movement means happier customers.
Conversion Metrics
Do you know which actions turn visitors into customers? Conversion metrics reveal where your website excels or falls short. The average site converts at 5%, but top performers like Shopify hit 2.9%—beating the 1.8% industry standard.
Conversion Rate
This measures how many visitors complete desired actions. Tools like Hotjar use heatmaps to show where users click or drop off. Fixing friction points can lift rates by 20% or more.
Value per Visit
Not all traffic is equal. Intercom assigns $500 to demo requests, prioritizing high-value leads. Track this to allocate budgets wisely.
Marketing Qualified Leads (MQLs)
Drift qualifies SaaS MQLs by engagement depth. A 40% MQL-to-SQL conversion benchmark separates serious prospects from window-shoppers.
Landing pages play a key role. Unbounce and Instapage help test variants, boosting conversions by up to 30%. Small tweaks create big wins.
Marketing Performance Metrics
Profitability hinges on three critical calculations. Tracking cost efficiency, revenue impact, and investment ratios separates thriving businesses from struggling ones. These indicators reveal whether your budget drives growth or drains resources.
Cost per Lead (CPL)
HubSpot users average $50 CPL, while Marketo campaigns hit $83 for professional services. This acquisition metric shows how efficiently you attract prospects. Lowering CPL by 20% can double your lead volume without budget increases.
Marketing ROI
Shopify achieves 300% returns on ad spend by tracking revenue per campaign. The manufacturing sector averages 4:1 ROI. Calculate this by dividing net profit by total cost.
CLV/CAC Ratio
Netflix maintains a 3.8 ratio—spending $1 to earn $3.80 long-term. ProfitWell’s template helps model this. A $1M campaign breaks even at 2.5:1, proving why this metric dictates scalability.
Retention Metrics
Are you losing customers faster than gaining them? Retention metrics reveal how well your product keeps buyers engaged. A 5% reduction in churn can boost profits by 25–95%, making these numbers critical for long-term growth.
Customer Churn
Churn measures how many customers leave over time. Zoom’s pandemic-era 0.5% rate set industry standards. Tools like Zendesk automate retention flows, reducing exits via timely support.
Customer Lifetime Value (LTV)
LTV predicts total value per customer. Amazon Prime members spend $1,400 yearly—proof that loyalty pays. Enterprise clients often hit $1.2M LTV, justifying higher acquisition costs.
Net Promoter Score (NPS)
NPS gauges loyalty on a 0–100 scale. Apple’s 72 outshines Samsung’s 47, reflecting stronger customer satisfaction. SaaS firms average 72, with scores above 50 considered excellent.
Dollar Shave Club’s viral retention tactics show creativity matters. Combine data with engaging experiences to keep buyers coming back.
Digital Marketing Metrics
Ever wonder why some ads outperform others by 400%? The secret lies in tracking three core indicators: engagement costs, conversion quality, and profit margins. Digital marketing thrives on precision—not guesswork.
Click-Through Rate (CTR)
CTR measures how often users click your ads. TikTok averages 3.2%, crushing Instagram’s 0.8%. High CTR signals compelling creatives or targeting. Low rates? Test headlines or audience segments.
Cost per Click (CPC)
Google Ads averages $2 CPC, but niches vary. Legal advertising hits $8, while retail stays near $1. Use Google Ads Editor to pause high-CPC keywords. Focus budgets on converters.
Return on Ad Spend (ROAS)
E-commerce aims for 400% ROAS. Canva’s Pinterest campaigns hit 280% by aligning visuals with user intent. DTC brands target 5x returns. Track ROAS weekly to adjust bids.
Pro Tip: Compare platforms like Facebook (1.9% CTR) against TikTok. Allocate spend where users engage most. Small tweaks yield big wins.
Social Media Metrics
Which social media numbers actually drive business growth? The answer lies in three key indicators. Tracking the right data transforms random posts into revenue-generating assets.
Engagement Rate
Red Bull’s 8.7% Instagram rate crushes the 1.6% Twitter average. Engagement measures likes, shares, and comments. High rates signal resonant content.
Tools like Sprout Social simplify tracking. Compare platforms to focus efforts where your audience interacts most.
Virality Rate
A viral coefficient above 2.5 means exponential reach. Old Spice’s campaign hit 10x, spreading like wildfire. Track shares per viewer to gauge potential.
Virality hinges on relatable, shareable content. Memes, challenges, and humor often win.
Video Completion Rate
Wistia’s 75% benchmark outperforms YouTube’s 45%. Short, vertical videos (9:16) thrive—GaryVee’s strategy proves this. Hook viewers in the first 3 seconds.
Analyze drop-off points. Edit ruthlessly to keep your audience watching.
Email Marketing Metrics
How effective are your email campaigns at driving real results? The average open rate sits at 21%, but top performers like Grammarly achieve 38%. Tracking three key indicators transforms your list from a contact database into a revenue engine.
Open Rate
This reveals how many subscribers actually view your content. Grammarly’s 38% success comes from personalized subject lines. Mailchimp’s A/B tests show emojis boost opens by 17%.
Segment your list by engagement history. Dollar Flight Club saw 22% higher opens when targeting frequent travelers separately.
Unsubscribe Rate
A 0.5% rate is acceptable, but Airbnb maintains 0.2%. Their secret? Value-packed content over sales pitches. Monitor spikes after each send to identify problematic topics.
Revenue per Subscriber
Brooklinen generates $68 per email contact, crushing the $42 average. Their strategy? Exclusive offers for loyal buyers. Track this metric monthly to gauge list quality over quantity.
Conclusion
Is your growth strategy built on the right numbers? Only 23% of teams track KPIs confidently, leaving huge opportunities untapped. Focus on three pillars: acquisition, conversion, and retention.
CLV/CAC ratios reveal long-term success. A 3:1 ratio means every dollar spent earns three back. Tools like Planful cut reporting time by 40%, turning chaos into clarity.
Avoid “zombie metrics”—data that looks good but doesn’t drive business outcomes. Audit your dashboard quarterly. Replace vanity stats with actionable insights.
Ready to refine your approach? Start with a free KPI audit today. Precision beats guesswork every time.
FAQ
What are the most important brand awareness metrics?
Impressions, first-page keyword rankings, and social media engagement metrics help measure how well your audience recognizes your brand.
How do pipeline metrics impact business growth?
Tracking second-stage meetings, SQLs, deals closed, and pipeline progression helps assess sales efficiency and revenue potential.
Why is conversion rate a critical metric?
It shows the percentage of visitors who take desired actions, like signing up or purchasing, indicating campaign effectiveness.
What does Cost per Lead (CPL) measure?
CPL calculates the average expense to acquire a new lead, helping optimize budget allocation.
How does Customer Lifetime Value (LTV) influence strategy?
LTV predicts long-term revenue from a customer, guiding retention and acquisition investments.
What’s the difference between CTR and CPC?
CTR measures engagement by clicks relative to impressions, while CPC tracks the cost of each click in paid campaigns.
Why track social media engagement rate?
It reveals how actively your audience interacts with content, indicating relevance and brand affinity.
What does a high unsubscribe rate in emails suggest?
It may signal irrelevant content or excessive frequency, prompting a need for audience segmentation.
How is Return on Ad Spend (ROAS) calculated?
ROAS divides revenue generated by ad costs, showing profitability of advertising efforts.
Why monitor Net Promoter Score (NPS)?
NPS gauges customer loyalty and satisfaction, predicting retention and referral potential.


